Selected Scientific Visualizations
Over the past few years, I’ve created scientific visualizations as part of final projects in several college courses. Here, I want to highlight a couple of interesting examples. You can find details on all of the projects I’ve completed throughout college on my GitHub.
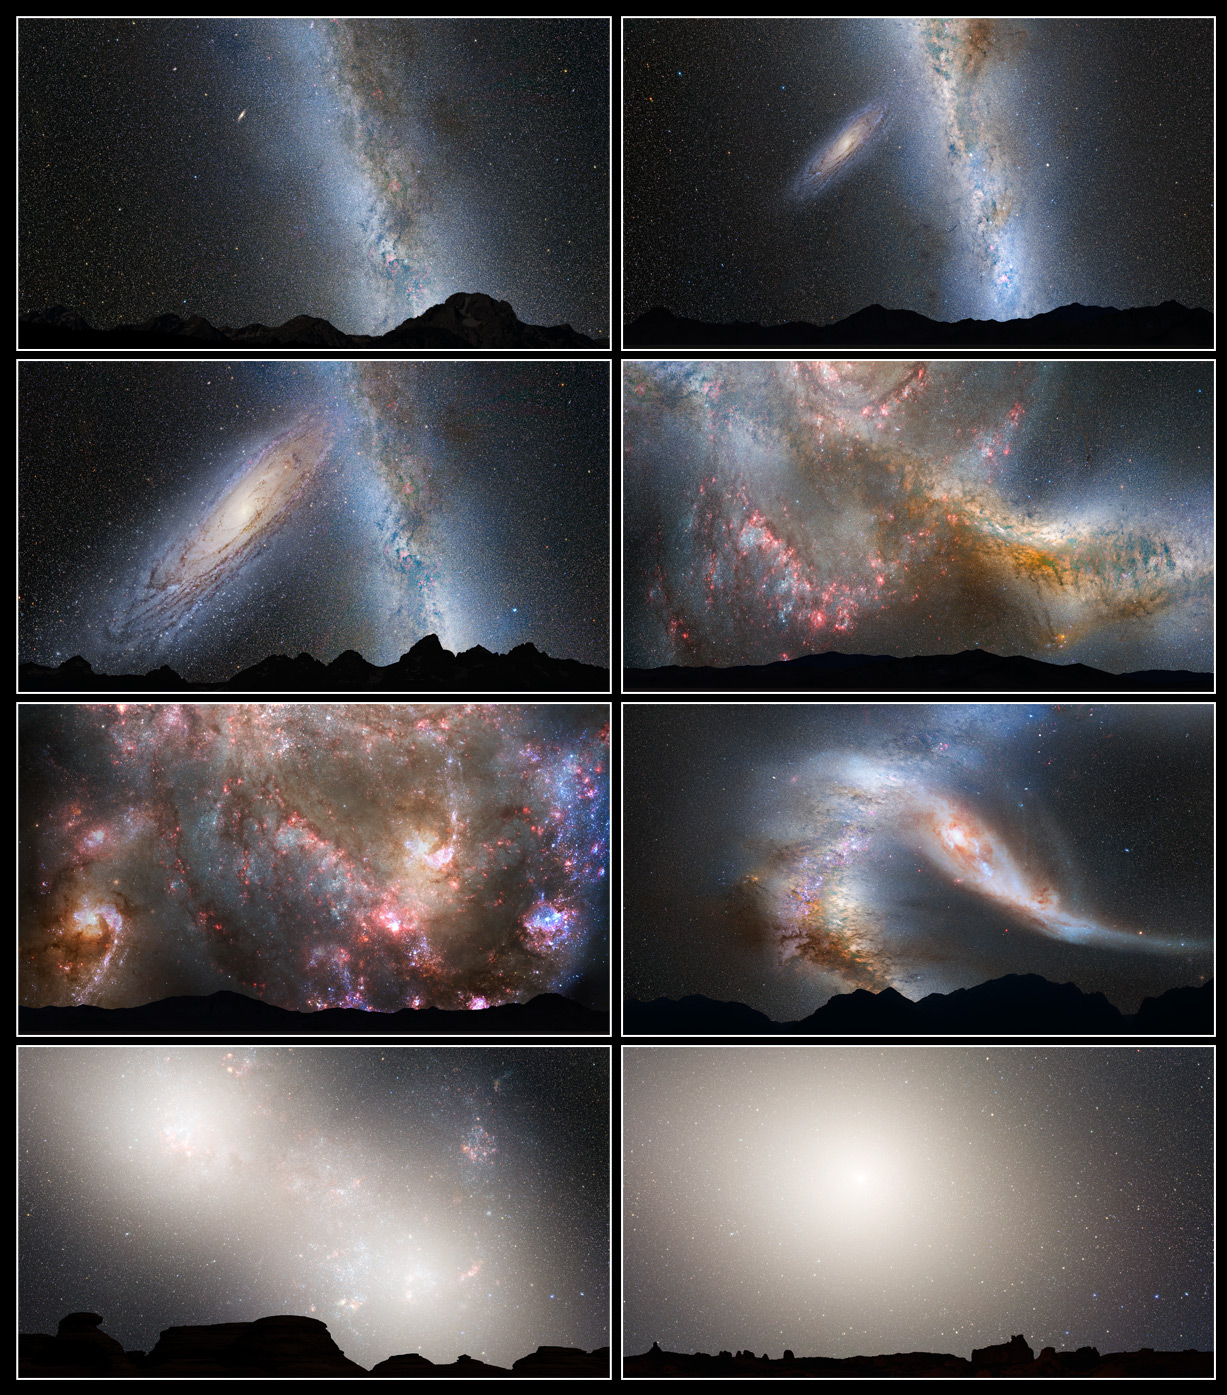
Most recently, I completed a project for my Theoretical Astrophysics course involving the future collision of the Milky Way and Andromeda galaxies. These two spirals are set to merge in approximately 6 billion years. I’ve always thought this was fascinating. If humans were still around, they’d witness a fantastical, bedazzled sky envelop them every single night. How would people make sense of such a world-changing event? Although the Earth would be in no danger, I think that this collision of giants would give people an eerie perspective and remind us of our minuteness in the face of the ever-expanding cosmos.

I learned that there’s a word for the awareness of the smallness of one’s perspective: occhiolism. I felt a healthy dose of it working on this project. Specifically, I was looking at Sun-like systems in Andromeda and observing their long term fates. These star systems are at a similar distance from the center of Andromeda as we are from the Milky Way’s core. By looking at these mirror worlds of the Solar System, we can gain information about how populations of stars evolve over time and how galaxy collisions impact their orbits. The instructor for the course, Professor Gurtina Besla, previously worked on creating a mind-blowing simulation which tracked the motions of stars in the Milky Way, Andromeda, and the small Triangulum galaxy over the course of 10 billion years. Using her simulation data, I tracked the Sun-like systems over billions of years, giving an eerie view of what future may lie ahead of the Solar System. In this video, Andromeda is shown in orange, the Milky Way in green, and the Triangulum galaxy in red. Sun-like stars are shown as black dots. YouTube compression significantly reduces the quality of the visualization, so check my GitHub repo for more information and an uncompressed version.
This video reminded me of another I made a while ago looking at the rings of Saturn. Saturn’s rings aren’t solid, but they’re made up of tiny particles of ice, rock, and dust. If you look closely, you’ll notice that there are actually several gaps throughout them, and the origin of this fact is really interesting.

These gaps are mostly created by a phenomenon called orbital resonance. It’s a two word phrase that has caused more unnecessary confusion than nearly any other in all of astronomy and physics. It’s difficult to put it in words, but a visualization can show it intuitively. The YouTube educator Steve Mould did a wonderful job explaining it in their video, so I’ll go ahead and link to that here. Give it a watch if you’re interested in the physics behind these ring gaps.
There’s a gravitational force between any two objects in the Universe. If you want to make a simulation with a small number of particles, you can just calculate all these pairs of forces at a given time and solve for the orbit. But if you try to apply this method to a system with millions of particles, like Saturn’s rings, you’ll realize it’s practically impossible. The sheer number of calculations required overwhelms even our modern day lightning fast computers. Even for my simulation, which used only around 30,000 objects, it would take years to run this way. To get around this, we can make some approximations. The method I used is called the Barnes–Hut algorithm, which I describe in detail in my final report and project repository. The basic idea is that the gravitational force between two objects gets weaker the further apart they are, so when we calculate the total force on a particle, we can save most of our computational effort for nearby masses and cut corners for the ones further away. The results I got are really satisfying to see, and they show how a gap in the rings can be opened up seemingly out of nowhere.
I hope you enjoyed this brief tour of some of my projects and got inspired by these visualizations. Whether you have some programming experience and want to try making your own or are fascinated enough to seek out others, I wish you the best of luck on your journey of exploration!

